In this use case we explore how you can connect to the Nimbus OData Feed API using Excel. This is useful if you want to have a quick look into the data structure and content without fully committing to Power BI, but also powerful for creating dashboards.
How-to Steps
Step 1: Register the enterprise application "Nimbus OData Login" in your tenant
🔎 This step is described in Use Case - Connecting to OData via Postman.
Step 2: Load the data from the OData feed into an Excel spreadsheet
- Open Excel and go to the Data menu.
- Choose Get Data > From Other Sources > From OData Feed.
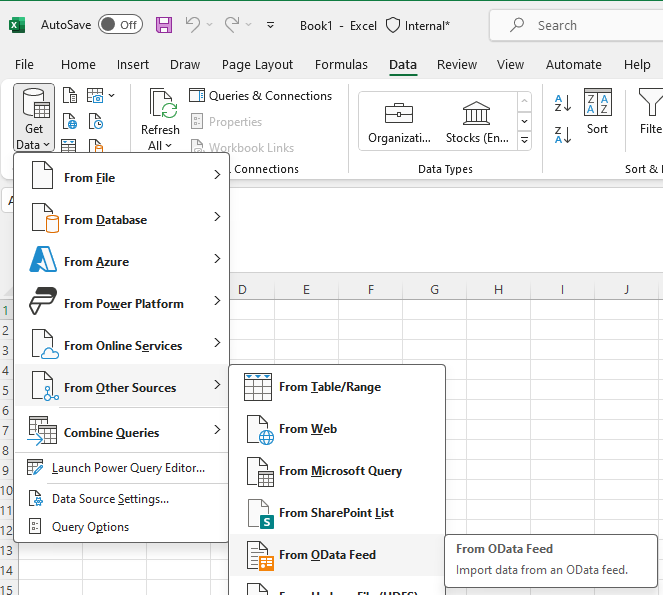
-
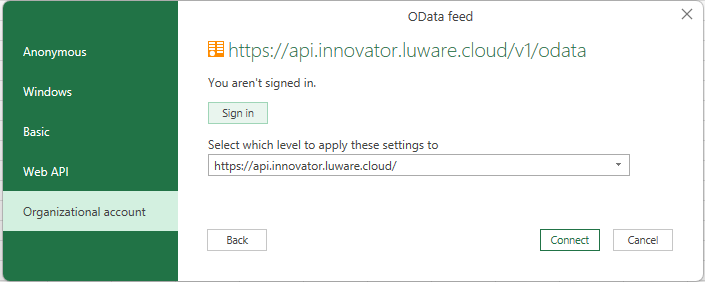
Enter your OData API URL and sign in with the organizational account which has access to some Nimbus data. This is either a tenant admin or a Nimbus user with either role: team owner, service supervisor, or user supervisor.
🔎Refer to Reporting Roles for more details.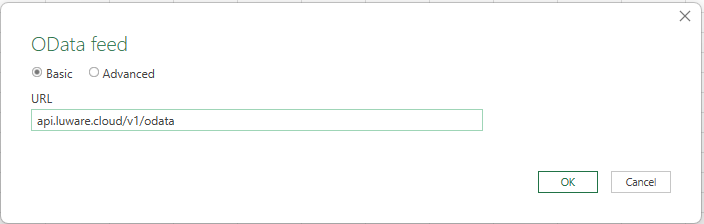
⮑ Once connected, Excel will show the data navigator which allows you to choose singe tables or transform the data before importing it into Excel: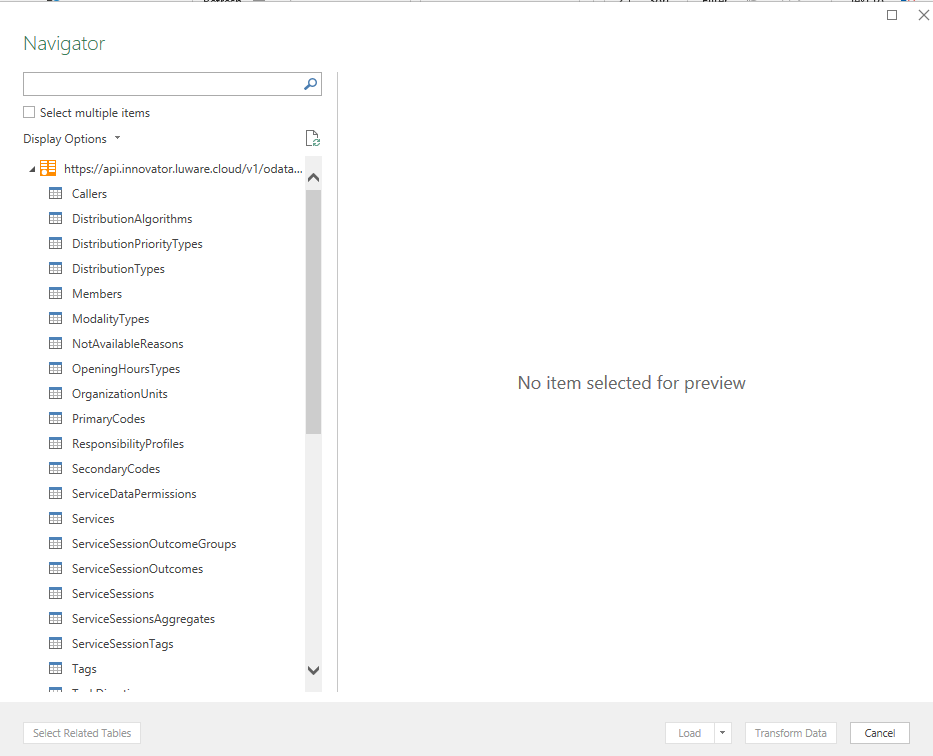
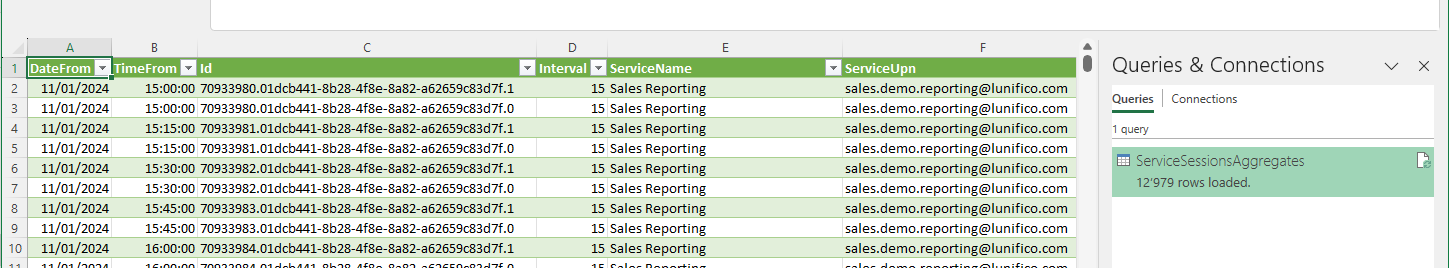
- Once you load the data into the spreadsheet, you'll see the Queries & Connections side pane alongside to the spreadsheet containing the data:
Step 3: Get your data visualized
PivotTables and charts are easy to create with a few clicks and allow you to quickly analyze the data manually.
Get help on how to create dashboards or how to build useful data queries from the Microsoft Documentation:
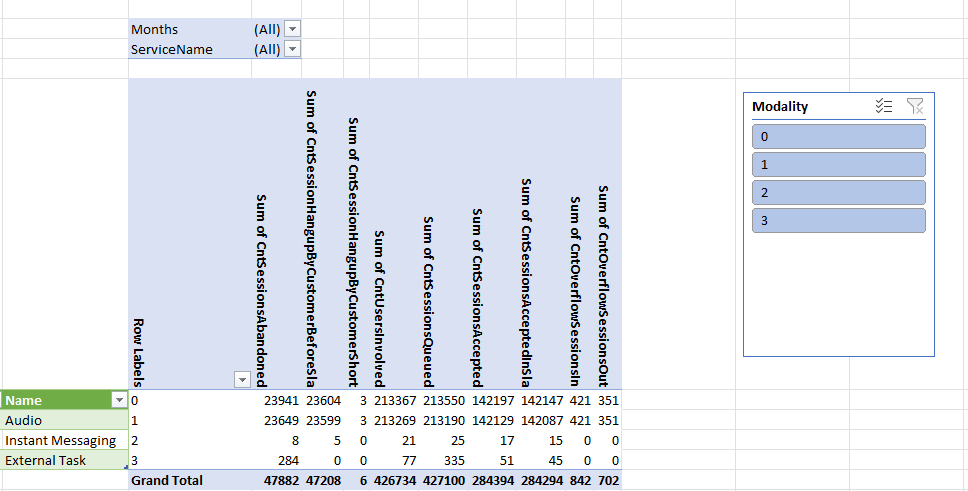
Here is an example pivot table based on the aggregated service data from the Nimbus OData feed. It shows counts of service session per modality per outcome (Abandoned, Queued, Accepted, etc.):