Paginated reports offer performance overview reports, compared per period (month, week, date):
- Service Performance shows multiple performance KPI in context of Services: total calls, handled calls, %SLA etc.
- User Performance show multiple performance KPI in context of Users: total calls, handled, missed ,declined etc.
| Parameter | Data type | Description |
|---|---|---|
| Service | Text, allow multi select | List of services, in report |
| Users | Text, allow multi select | List of users, in report |
| Group by | Text, single select |
Determine report grouping Month/week/date In scope with group by parameter this determines report data start date. |
| Group count | Integer | Count of full “group by” periods added prior to current. 🔍 The Current period (marked with *) is added implicitly, so group count "0" is still valid. Example: group by = “Month”, Group count = “2”, today is “September 23”. → 3 months will be shown: July, August, September* |
| Green zone | Integer | %Threshold of green/yellow color of the KPI indicator |
| Yellow zone | Integer | %Threshold of yellow/red color of the KPI indicator |
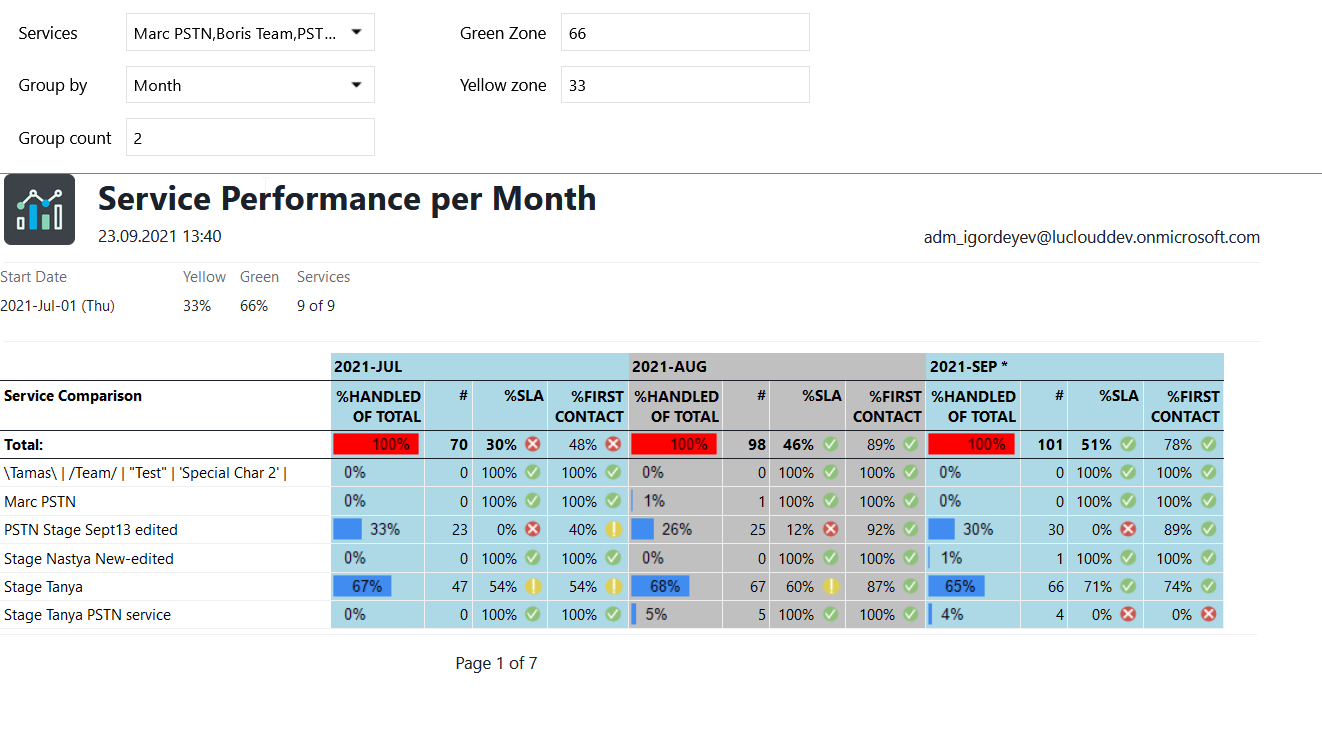
Example of a performance overview report