Luware BI Template Files
INC Nimbus Power BI Files
📊Power BI Template Files
✅Template Download: To get the latest version, visit User Preferences (Admin) > Resources > Usage > Power BI Template to download, or ask your Nimbus Administrator to retrieve it for you. Also check the Nimbus BI Template Release Notes for the latest changes on the template functionality.
✅ Usage Instructions:
- First Time Users: To connect the Template to your Nimbus data source, read Setting Up Power BI. While setting up the Template (.pbit), you need to provide connection parameters and your Reporting Role User credentials to perform a first query.
- Performance: Once setup is done, save your template as a .pbix report, as it will use considerably lower RAM/CPU than a template.
- Daily Usage: Visit Nimbus Power BI Template for further details on the template itself.
INC Reporting Template Disclaimer
DISCLAIMER: Power BI Template updates and support
Note that we continuously develop the template not just visually, but also to reflect the latest OData Feed and Nimbus Reporting Model data warehouse concepts. This also requires our Power BI template to be updated in regular intervals.
While we strive to maintain backwards compatibility, your older stored Power BI file template versions can become outdated over time. This is also due to the physical nature of Power BI files and Power BI App development itself, resulting in Nimbus data not being queried as expected anymore and/or features getting deprecated and replaced over time.
Recommendation: Regular BI Template Updates
As communicated via our Nimbus BI Template Release Notes we are constantly improving our products, including the Nimbus BI template; this results in changes, not just to visible template functionality, but also the underlying queries. Since each improvement can only be delivered in the form of a new physical file, we never make retroactive adjustments to older versions of the template, and thus, we cannot guarantee that an old template file will continue to work indefinitely as expected.
For those reasons we strongly recommend the following:
✅Regularly check the Nimbus BI Template Release Notes for any changes on features that you use.
✅Update your template at regular intervals to ensure seamless interaction with the OData Feed and any Nimbus updates.
Note: Support on customized Templates
While we understand the need and allow our users individually to customize the Nimbus Power BI Template, please understand that this also introduces a huge variety of possible error causes. We gladly take customer feedback to continuously improve our template in general, however this must be done by striking a balance between features, clarity, maintainability and stability.
☝For the reasons above, please understand that Luware Support cannot assist you with your own customized templates.
✅Whenever you encounter errors on your customized templates: Please ensure to test in parallel with the newest BI Template first, before contacting customer support.
Template Overview
The Nimbus BI template consists several views/tabs:
- Service Overview - Service Session KPI aggregated by service.
- User Overview - User Session KPI aggregated by user.
- Session Details - KPI by service session (can be used to drill down into a KPI from Service Overview).
- User Session Details - KPI by user session (can be used to drill down into a KPI from User Overview).
- Tags-Codes - Tags and Codes as recorded in My Sessions view by users.
- Unified Sessions - Provides the details of the end-2-end concept of a conversation in the business world (e.g. an end-2-end call). A session is a transaction in Nimbus, a unified session can contain one or more service sessions and user sessions.
- User States - Provides duration KPI aggregated by user and state type as well as profile names and not available reasons (if applicable), based on every single state change recorded in User States
- Transfer - Provides a high level view of transfer sessions volume, as well as a grid with details of each transfer.
- Info - Template versioning, session volume and other technical details needed when opening support tickets with Luware.
- Data Load Check - Shows a data count and summary for each main KPI table, as well as the timestamp of first and last session record for each table. This is especially useful with incremental refresh to evaluate the volume of data loaded in the report as well as the completeness and freshness of the data in each KPI table.
🔎 Each tab is described in further detail below. Data shown is based on the Nimbus Reporting Model.
💡 The Nimbus KPI Calculations are completely done in the product itself, the report does only query the results.
Template Tabs
GOOD TO KNOW
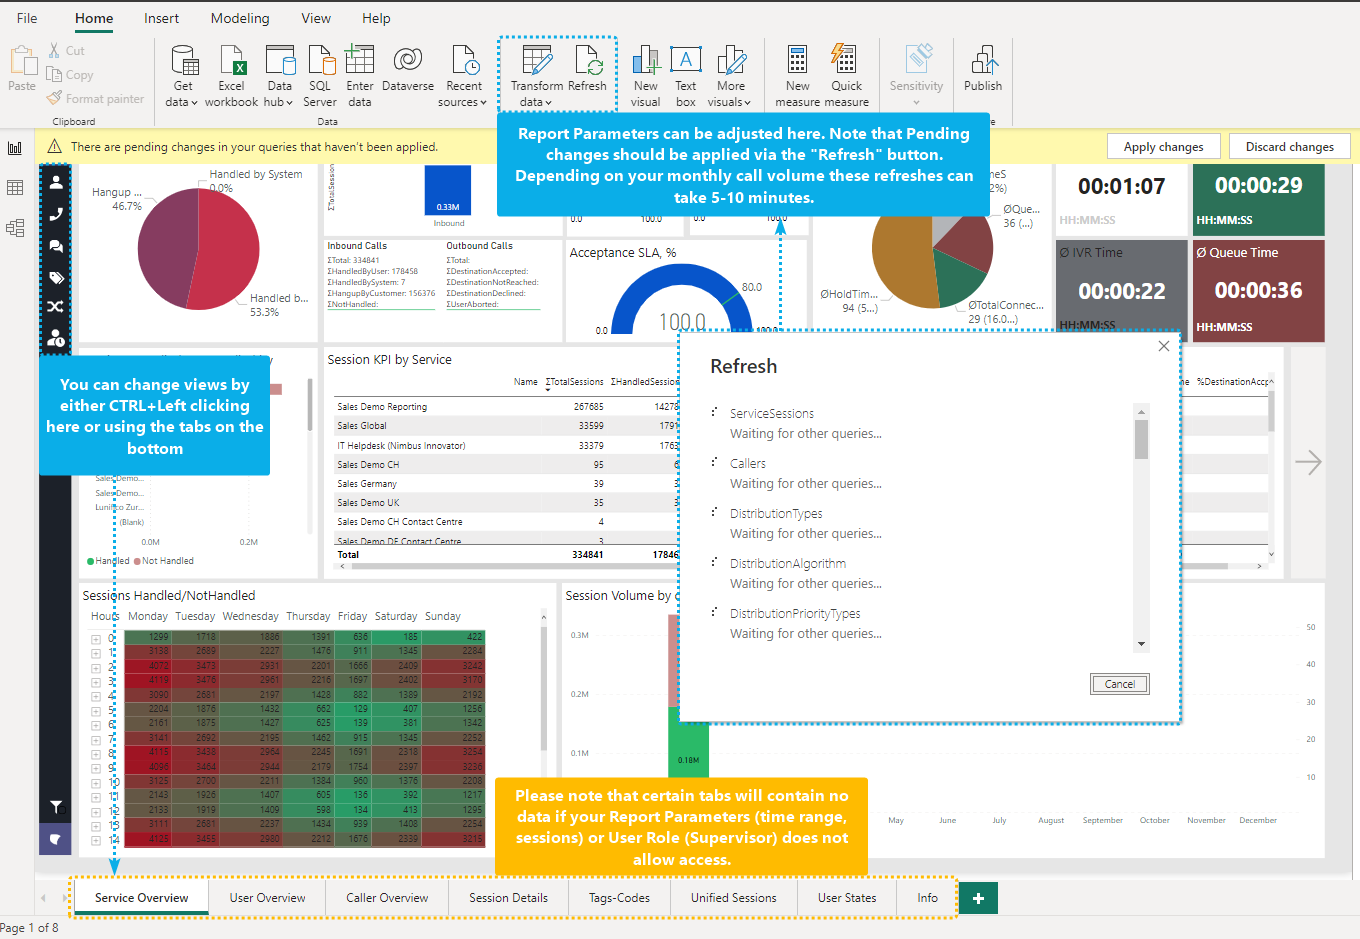
To switch between the tabs and views:
- Hold CTRL and left-click on the icons at the left hand sidebar
or - Use the tabs at the bottom of the report to navigate
Also noteworthy:
- In Power BI Desktop you must use CTRL + Click on buttons and links, otherwise you may just select fields in the template for editing.
- CTRL is also used to multi-select filtering options and list entries.
- Arrows indicate Drill-Through possibilities into further data.
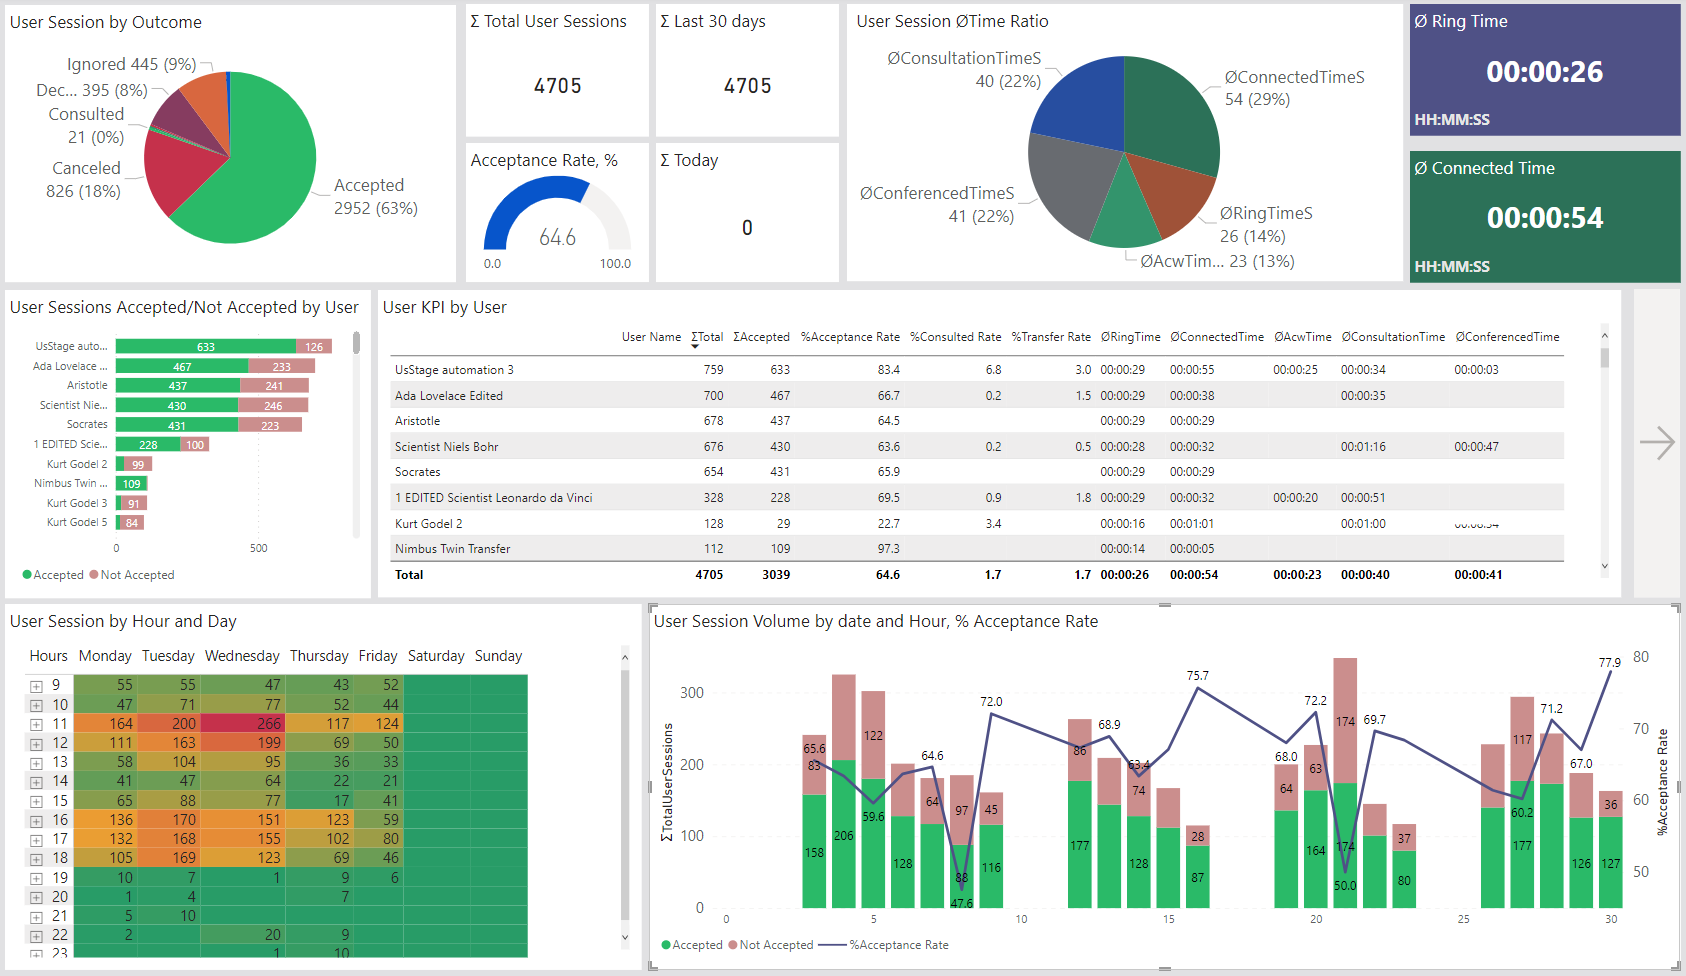
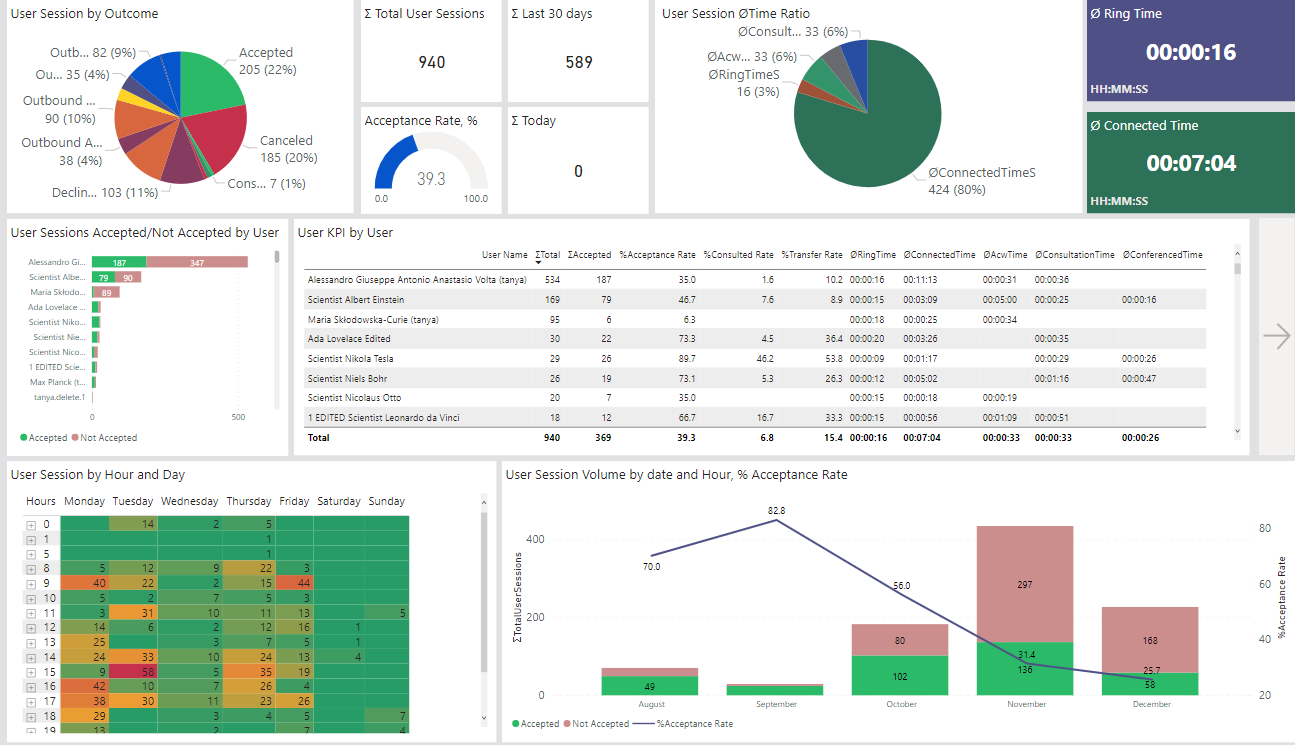
Overview pages
Service and User Overview
|
Service and User Overview provide a general overview of the sessions associated with a user or a service. Here you may find:
💡 You can drill through a selected user session for details as described in the “How to use” chapter below. | |
 |
 |
Session Detail pages
Session Details and User Session Details
Session Detail pages give a closer look on the distinct sessions accrued on the Service / or the User.
💡 You can drill through a selected session for details as described in the “How to use” chapter below.
Tags and Codes
Tags and Codes
Tags and Codes specified by users during (via the My Sessions UI) are shown as a tag cloud in the reporting template. The bigger the tag shown, the more frequent it has been used.
For example you can click on tags to ...
- ... narrow down data by user / service sessions that used these tags.
- ... identify months where tags have been used more frequently.
- … identify users that were using those tags.
In the Nimbus Power BI template we have two pages to provide an example of how tags and codes can be analysed from from two different perspectives.
Tab: Tags-Codes 1st User
Shows tags and codes assigned by the first accepting user. ☝If the first accepting user didn't add any tags or codes but the subsequent user did, then this page will not show any tag or codes assigned to that service session. Use this page if you want to analyze the tags and codes assigned at the first user touch point.

Tab: Tags-Codes: All Users
Allows to analyze all tags and codes assigned by all users across various user sessions. Use this page if you want to analyze tags and codes across all user touchpoints in your services.

☝Non-retroactive feature: Please be aware that the data separation into two tabs is a recent feature. Data was generated since October 2024. For tags and codes recorded before that point please refer to the tab “Tags and Codes 1st User”.
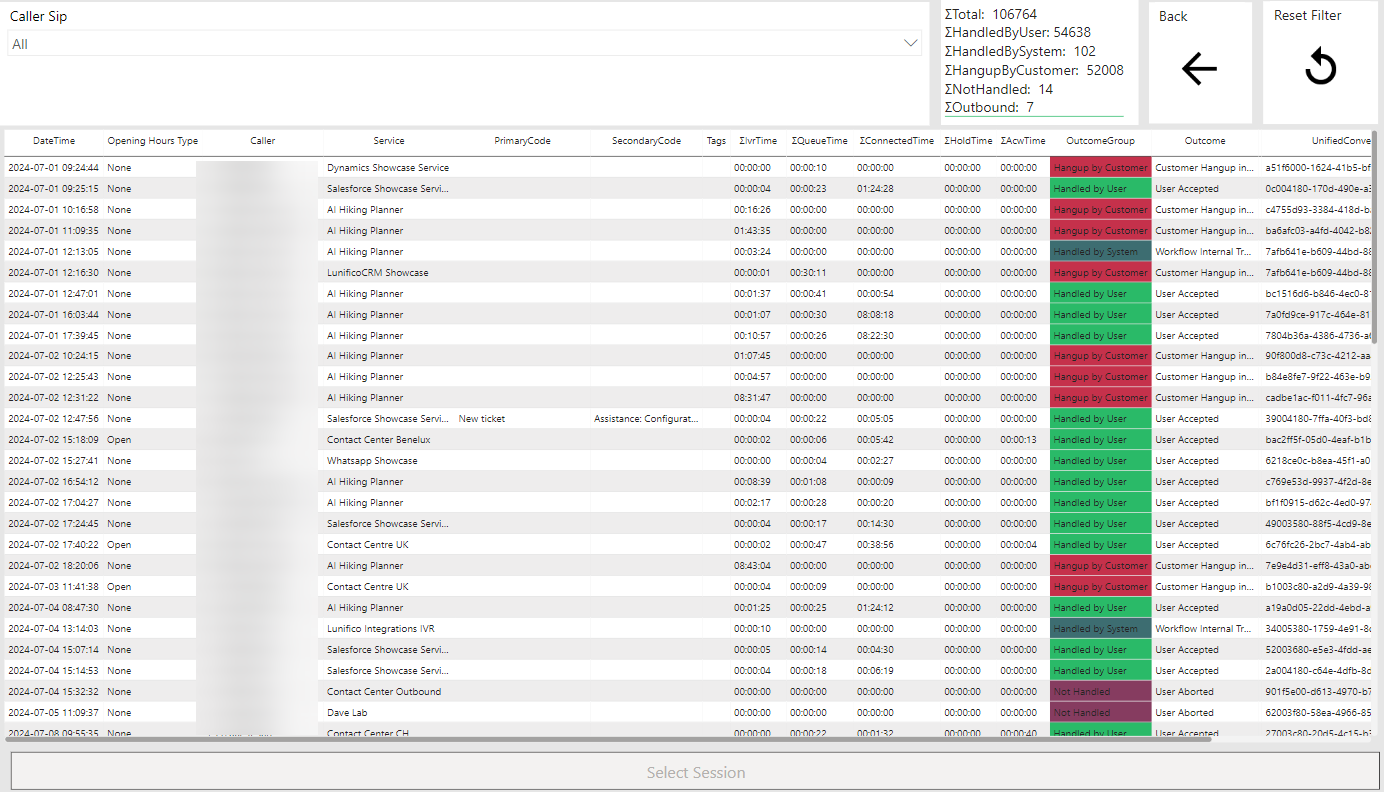
Unified Sessions
Unified Sessions
Lists Caller (customer) data like PSTN or Name, the Caller path and connection times with the final session outcome.

💡 Click on a Session, then CTRL+Click the button on the bottom to show further details. Also see “How to use” chapter below.
Related Info
- Update Frequency: note that Unified Session can take up to 1hr after the end of the last Service Session or Unified Session in the series of Sessions of belonging that Unified Session (end-to-end-interaction) to fully load and become visible in the OData Feed.
- To learn more about Unified Sessions and related User and Service Sessions, visit Nimbus Reporting
User States
User States
This tab lists User States, also referred to as "Team Enability" (e.g. the On/Off Service participation toggle in the Frontend UIs during daily use of Nimbus).
PRECONDITIONS
Contact Center Licensing - please note that reporting on tracked User States is a Contact Center feature.
✅Feature toggles
✅Tenant Admin Feature Toggle - To gather User State data, this feature needs to be enabled for your tenant. This is done via Tenant Administration > Data Privacy > "Persist User States in Reporting" option.

You can learn more about each feature in the Tenant Administration pages.
✅ Power BI parameters - In the Power BI template, the connection parameter “Load User States” must be set to “True” before refreshing the dataset.
☝Impact on your Data Query: Tracking presence states can generate considerable amounts of personal user data. Aside from Power BI query performance considerations on a large userbase you need to consider privacy and EU GDPR compliance before enabling this feature.
🤔 What User States data is being tracked? User, User ID, Organization Unit, Responsibility Profiles (User State), MS Teams Presence Status and all related event changes with timestamps and durations.
✅ Supervisor Role Requirement
User Supervisor Role - The user refreshing the Power BI report must be a Nimbus User Supervisor (this role can only be assigned to a user with a Contact Center license).
- The User States tab in Power BI will not show any information unless you have this role assigned via the User Administration. More infos on this role can be found on User Role (RBAC) Matrix.
- The Nimbus User Supervisor will see user states for all users in the supervised OUs irrespective of whether such users have a Contact Center license or not.
Organization Units dependency - The Nimbus User Supervisor will only see the user states for the users in the Organization Units they are explicitly assigned to (as a Supervisor).
LIMITATION BY DESIGN If a user has only Supervisor and not a Team Owner / Service Admin role, only the "UserStates" dataset in the report will be shown, consisting of: UserStates, StateTypes, ResponsibilityProfile, OU, Users. Other tabs and queries in the BI Report may appear blank.
→ This is intended by design to prevent exposure of individual Service/User/Session data to the wrong audiences. To see a full dataset, the same user also needs a "Service/Team Owner" role assigned.
🤔 What are user states?
User States
For its Reporting Model, Nimbus performs checks on various User States. You can think of this as a multi-factor validation performed by Nimbus in order ensure a user is ready (and suitable) to take an incoming task from the internal queue. In short, the user is either considered as “selectable” or “not selectable”.
| Factor | Tracked User State relevant to Nimbus | ||||||||
|---|---|---|---|---|---|---|---|---|---|
| Teams Layer (monitored by Nimbus, always manually controlled by user) | |||||||||
| Presence in MS Teams | User is not present on the machine | User can make and receive Non-Nimbus calls. | Online AND set to any presence that Nimbus considers “not selectable” | Online AND set to any presence that Nimbus considers “selectable” Set to any presence that Nimbus considers “selectable” ▼ | |||||
|
Offline (Appear Offline) |
Signed in | DND | Busy in a call | Busy |
Away (Appear Away, Be right back) |
Available | |||
| Nimbus Layer (in addition to Teams, according to dependencies described above▲ or below ▼ ) | |||||||||
| Offline Presence check |
► Offline User will not receive Nimbus tasks. |
User is inactive in all MS Teams-based services… AND/OR in Off Duty Profile |
🔎Configurable Distribution Service Settings exception: MS Teams "Busy" or “Away” status ▲can be opted-in, making users Selectable ▼ for Tasks |
||||||
| Service assignment check |
►Off Duty User will not receive Nimbus tasks. |
Active in Nimbus - MS-Teams based Services will distribute to this user. 🔎Individual Active toggles: Each Service has individual “Active” toggles, allowing users to steer availability per Service. |
|||||||
|
On Duty Profile - Contact Center Services will distribute to this user. 🔎 Profiles and Skills: Any "On Duty" type Responsibility Profile allows Contact Center participation. For the user to be "Selectable" ▼ Skills and Responsibilities defined in the profile must match the Service. This is determined by the individual Distribution Policies assigned to the respective Service. | |||||||||
| Conditional Presence check |
❌►Not Selectable User will not receive Nimbus tasks. |
||||||||
| Task count check |
Task Parallelization is enabled for the user. AND user is Available ▲ OR Service configuration says "Busy/Away - Distribute to the user" … AND user has reached tasks limit … AND all the tasks are in non-blocking states. |
||||||||
|
► Task Limit Reached User will not receive Nimbus further Nimbus tasks. 💡This state has lower priority than “Not Selectable” due to MS Teams presence ▲. | |||||||||
| Selectable state |
User can get at least one task User is Available or Service Distribution settings ▲ allow Busy/Away - Distribute |
||||||||
|
✅ ► Selectable User can receive Nimbus tasks. | |||||||||
| Nimbus Task-related states | User currently reserved and blocked by a Nimbus task. Can result in any of the following User States. | ||||||||
|
RONA User flag after not responding to a task, blocked for the next tasks. |
Ringing User is reserved for new task, but has not accepted yet. |
Dialing Out User accepted outbound task, is waiting for destination to accept. |
Connected User has accepted and is now blocked by a task. |
After-Call Work User-extensible timespan to complete work after a call. |
|||||
User State Factors explained
First and foremost, it is important to note that User State factors relate to each other. Reading the table above, relationships are indicated with arrows ▲▼. Expand the items below to learn more about each factor.
MS Teams presence
INC MS Teams presence dependency note
🔎Design principle: MS Teams presence is “read-only” to Nimbus
- Nimbus reads but never changes MS Teams Presence.
- Nimbus reacts to MS Teams presence changes, e.g. when …
- … the user receives an Audio/Video task in Nimbus, as MS Teams simultaneously switches to: Busy - In a call.
- … the user manually changes presence, e.g. to opt out of tasks via DND or Offline status.
- MS Teams presence always is the uppermost layer for Nimbus for any further User State validation and task distribution1.
💡Key learnings to take from this
- The presence check must always be passed first. Presence must meet the criteria of each service's individual Distribution Service Settings. As this is individual per Service, users may be conditionally “selectable” even while Away in MS Teams.
-
Online1 users are considered for Nimbus tasks when:
- …they are identified as Nimbus user - with a User Role assigned for one or multiple services.
- …they fulfill service's assignment criteria (Active Toggle enabled / On-Duty State).
- …they are not already handling the maximum number of Parked tasks.2
- …they are not already handling a “blocking” task in parallel.2
- …they are not already in After-Call Work (ACW) for any modality.
- Offline / DND users are generally not considered by Nimbus, and thus do not receive tasks.
1 Note that users can appear “available (green)” in their MS Teams presence within the Nimbus UI and Attendant Console search, but remain non-selectable for Nimbus tasks, including any transfers of existing sessions. Possible reasons could be Nimbus services blocking the user for reasons mentioned above, e.g. maximum number of tasks, or the user not being configured to handle the selected modality.
⮑In such cases, Nimbus will return an error when attempting the transfer.
2 When parking tasks, certain modality combinations are non-blocking and can be handled in parallel, e.g.an Audio/Video task + EITHER and Instant Messaging OR Email OR External Task. The allowed modality combinations and “blocking” tasks are described on the Task Parallelization page.
Service assignment & presence
These factors are shared criteria among Services, depending on the Services the users participate in. The Type of Service determines when a task is being distributed to selectable users:
| Advanced Routing and Enterprise Routing | Contact Center |
|---|---|
| Start condition: MS-Teams "Team”-based Services with a fixed pool of team members. Users are signed in within MS Teams | Start condition: Nimbus standalone Services with a dynamically assigned user base. Users are signed in within MS Teams |
|
Advanced Routing and Enterprise Routing consider users selectable once they are set “Active” in the Nimbus UI.  |
Contact Center Services replace the “Active” state with a Duty State as a conditional “is selectable” check.  |
| 💡The “Active” toggle is considered as “selectable” factor. | 💡The “Active” toggle is replaced by the Duty profile. Nimbus distributes according to the Skills and Responsibilities related to the profile. These criteria are defined in each Service's Distribution Policy. |
| Selectable are: The entire “Online” and ”Active" pool of users with in an Microsoft Teams Team is considered as selectable. | Any “Online” Nimbus user can be considered depending on the factors above, regardless of “MS Teams” membership. |
🔎Note: Mixed participation is possible
When users participate in multiple Services, a mix of “Active” toggle and “Duty Profile” can be leveraged by users to steer their participation.
💡Example: A user is “Signed In” in MS Teams and wants to steer presence in the Nimbus UI for multiple Services
| MS Teams Presence | Active Toggle |
Selectable for: Advanced- / Enterprise Routing |
On Duty Profile |
Selectable for: Contact Center |
| Signed in | ❌ | ❌ (not selectable while "Inactive") | ❌ | ❌(not selectable while “Off duty”) |
| Available | ✅ | ✅ | ✅ | ✅ (Distribution Policies apply) |
| Available | ❌ | ❌ | ✅ | ✅ (Distribution Policies apply) |
| Available | ✅ | ✅ | ❌ | ❌ |
| Away | ✅ | ✅ While Distribution Service Settings > Away > "Distributed to the user”. | ✅ | ✅ (Distribution Policies apply). |
| Busy | ✅ | ✅ While Distribution Service Settings > Away > "Distributed to the user”. | ✅ | ✅ (Distribution Policies and Distribution Service Settings apply). |
| DND | ✅ | ❌ (DND is always task-blocking) | ✅ | ❌ (DND is always task-blocking) |
Task count / limit check
Whenever Task Parallelization is enabled for a user, they can get multiple tasks distributed to them. This will happen when the following prerequisites are met:
- Task Parallelization is enabled for the user in their General User Settings.
- The user is “Selectable” according to the presence/mapping factors described above.
- The user is already Parking a task.
- The user is not in any task blocking state. → 🔎See table below, or visit the Task Parallelization page to learn more.
🔎Table: Task blocking states
INC Task blocking states
| Modality ► | |||||||
|---|---|---|---|---|---|---|---|
|
Direction ► State ▼ |
Inbound |
Outbound |
Outbound |
Outbound with Workflow |
None |
Inbound |
Inbound |
| Incoming | Blocking | Blocking | Blocking | Blocking | Blocking | Blocking | Blocking |
| Dialing Out | n/a | Blocking | Blocking | n/a | n/a | n/a | n/a |
| Connected | Blocking | Blocking | Blocking | Blocking | Blocking | Blocking | Blocking |
| Transferring | Blocking | n/a | n/a | n/a | n/a | n/a | n/a |
| On Hold | Blocking | Blocking | Blocking | Blocking | n/a | n/a | n/a |
| Parked | Non-blocking | Non-blocking | Non-blocking | Non-blocking | Non-blocking | Non-blocking | Non-blocking |
| Unparking1 | Blocking | Blocking | Blocking | Blocking | n/a | n/a | n/a |
| In ACW2 | Blocking | Blocking | Blocking | Blocking | n/a | n/a | n/a |
1 Not a visible state on the UI. While Nimbus is unparking a session, a “blocking” invitation in MS Teams prevents the user from receiving further tasks.
2 Also includes extended ACW. In general, the ACW timer will not start when a parked session is being terminated.
💡Good to know
Once the maximum numbers of tasks is reached, Nimbus will not distribute further tasks to the user.
Even with Task Parallelization enabled, additional factors may prevent the user from getting additional Tasks. Examples are:
- Being in any task-blocking state (according to the table above).
- Being in DND presence, marking the user as “not selectable”. This will take precedence the task limit.
Task-related states
This factor is considered by all Nimbus Services. Nimbus uses these flags to signal why a user is currently “Not selectable”. This is also done to keep a track record for Nimbus Reporting purposes.
Task states
Nimbus these states to make users unavailable for further tasks. For example:
- While already being in a blocking status (e.g. Not Selectable, already busy in a task, in After-Call Work (ACW) or flagged by RONA from not answering a task), no further tasks will be distributed to the user.
- ACW, Connected and Ringing are reported as dedicated states, all other blocking statuses are reported as “Not Selectable”.
- “Offline” in Teams or “Off Duty” in Nimbus are also reported as dedicated User States.
🔎Table: Overview of User States
INC User State Type Table
For Reporting purposes Nimbus tracks User States, which define the ability of a User accept and handle tasks. Below is a table of these tracked states:
Id |
Name |
|---|---|
| 1 | Offline: User offline in MS Teams and thus cannot be selected for Tasks. |
| 2 | Off Duty: User is either in a “Offduty” Duty States or “Inactive” in Nimbus UI. |
| 3 | Selectable: User logged-in MS Teams and available to take Nimbus tasks. → Also see Task Queue and Distribution. |
| 4 | Not Selectable: User is in a MS Teams presence state that blocks task distribution as per Distribution Service Settings. |
| 5 | Ringing: A task has been assigned to an User but not yet been accepted. Can be either incoming calls or when an User is accepting an Outbound Call. Also applies for non-telephony-related modalities like Email, External Task, Instant Messaging etc. |
| 6 | Connected: The User and Customer are in a session together. Also applies when the User is just handling an External Task. |
| 7 | After-Call Work: User is handling After-Call Work (ACW). |
| 9 | RONA: User flagged with RONA state by a non-accepted task. |
| 10 |
Dialing Out: User has accepted an Outbound Call and Nimbus is now ringing the target Customer.
|
| 11 | Task Limit Reached: User has reached max allowed number of tasks assigned. Even if the user state would allow for new tasks, the task limit will prevent further distribution to this User. |
✅ Enabling User State Tracking & Data Privacy
Each time a user changes from one Status to another, a Nimbus Reporting record is written as an historic entry to the database. Transitions will therefore not appear in the UI, but only as timestamp record on each status change.
💡GDPR Data Privacy Opt-In: Tracking detailed User States allows for a time-based analysis of the states of each user. Note that this option generates a lot of additional reporting data that also reveals daily user habits. Tracking of this data must be explicitly enabled via Tenant Administration > Data Privacy in order to be recorded in the historic reporting.

INC User State Type Table
For Reporting purposes Nimbus tracks User States, which define the ability of a User accept and handle tasks. Below is a table of these tracked states:
Id |
Name |
|---|---|
| 1 | Offline: User offline in MS Teams and thus cannot be selected for Tasks. |
| 2 | Off Duty: User is either in a “Offduty” Duty States or “Inactive” in Nimbus UI. |
| 3 | Selectable: User logged-in MS Teams and available to take Nimbus tasks. → Also see Task Queue and Distribution. |
| 4 | Not Selectable: User is in a MS Teams presence state that blocks task distribution as per Distribution Service Settings. |
| 5 | Ringing: A task has been assigned to an User but not yet been accepted. Can be either incoming calls or when an User is accepting an Outbound Call. Also applies for non-telephony-related modalities like Email, External Task, Instant Messaging etc. |
| 6 | Connected: The User and Customer are in a session together. Also applies when the User is just handling an External Task. |
| 7 | After-Call Work: User is handling After-Call Work (ACW). |
| 9 | RONA: User flagged with RONA state by a non-accepted task. |
| 10 |
Dialing Out: User has accepted an Outbound Call and Nimbus is now ringing the target Customer.
|
| 11 | Task Limit Reached: User has reached max allowed number of tasks assigned. Even if the user state would allow for new tasks, the task limit will prevent further distribution to this User. |
Related Pages
- Also see Nimbus Reporting Model > User States table.
- Visit Nimbus Reporting for more details on how “User States” affect these results.
Transfers
Transfers
Allows to inspect where sessions are transferred to and to which result, so involved services can be optimized accordingly.
Can be filtered by:
- Start Date Time
- Service From
- Service To
Provides the following Visuals:
- Pie Chart "Transfer by"
- Pie Chart "Transfer by Result"
- Transfer Flow Diagram by Service
- Source Service
- Destination
- Service by Name
- External
- User
- Grid “Transfer Overview”
RELATED NOTES
- For related OData Tables on static dimensions and facts see Nimbus Reporting Model→ “Transfer Sessions”
- If there was more than one transfer session occurring during a single service session, it is stored in the Transfer Sessions table. However:
- If the last logical Workflow Activity of a service session was a transfer, then the "transfer" fields in service sessions table will be populated.
- if the last logical Workflow Activity was not a transfer (e.g. Transfer > Queue in new Service), then "transfer" fields in service sessions table will be left empty.
Info
Info
Shows the template version and (last) connected user that did the data refresh.
Data Load Check
Data Load Check
The Data Load Check page provides the full overview of the amount of data loaded in the tables that can be incrementally refreshed. It shows details of the number of sessions loaded for each of the fact table as well as the earliest and most recent session. This allows the user to get an idea of the amount of data loaded into the report and to verify the most recent available sessions available in the report.

How to use…
Drill ThroughDrill Through buttons provide a convenient way to navigate between entry overviews and detail pages. The drill through possibility is signaled with an arrow:
Example:
|
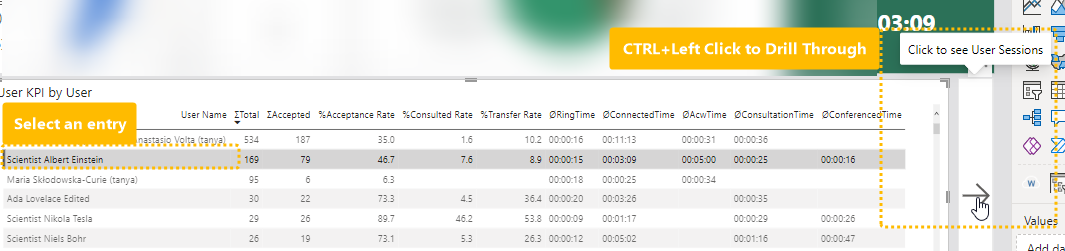  |
Data SlicersFrom within any tab you can narrow down the data with predefined slicers (filters).
|
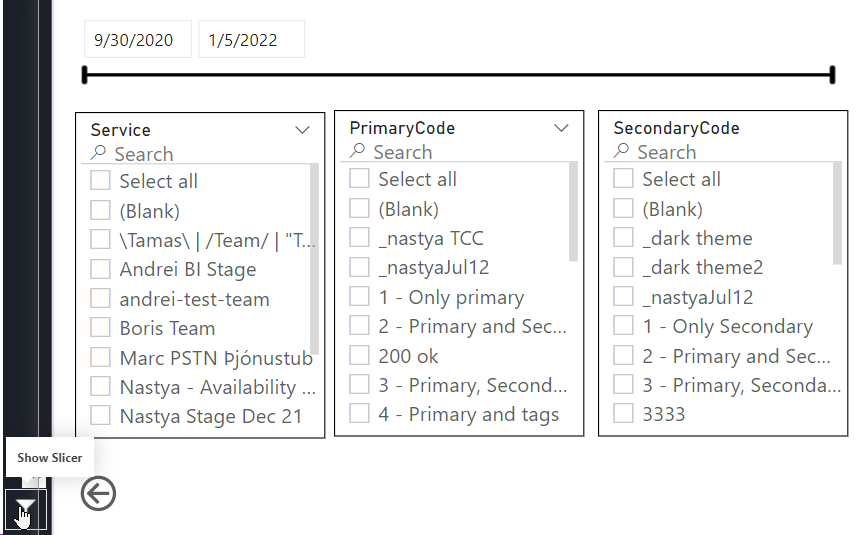 |

Template Troubleshooting
Did you encounter issues with the BI Template? Please refer to Setting Up Power BI > Known Issues and Solutions.