The "My Overview" tab is your personal dashboard, combining daily call metrics, call handling and team presence in one view. All functionality and data gathered is accumulated from all service teams that you are a part of.
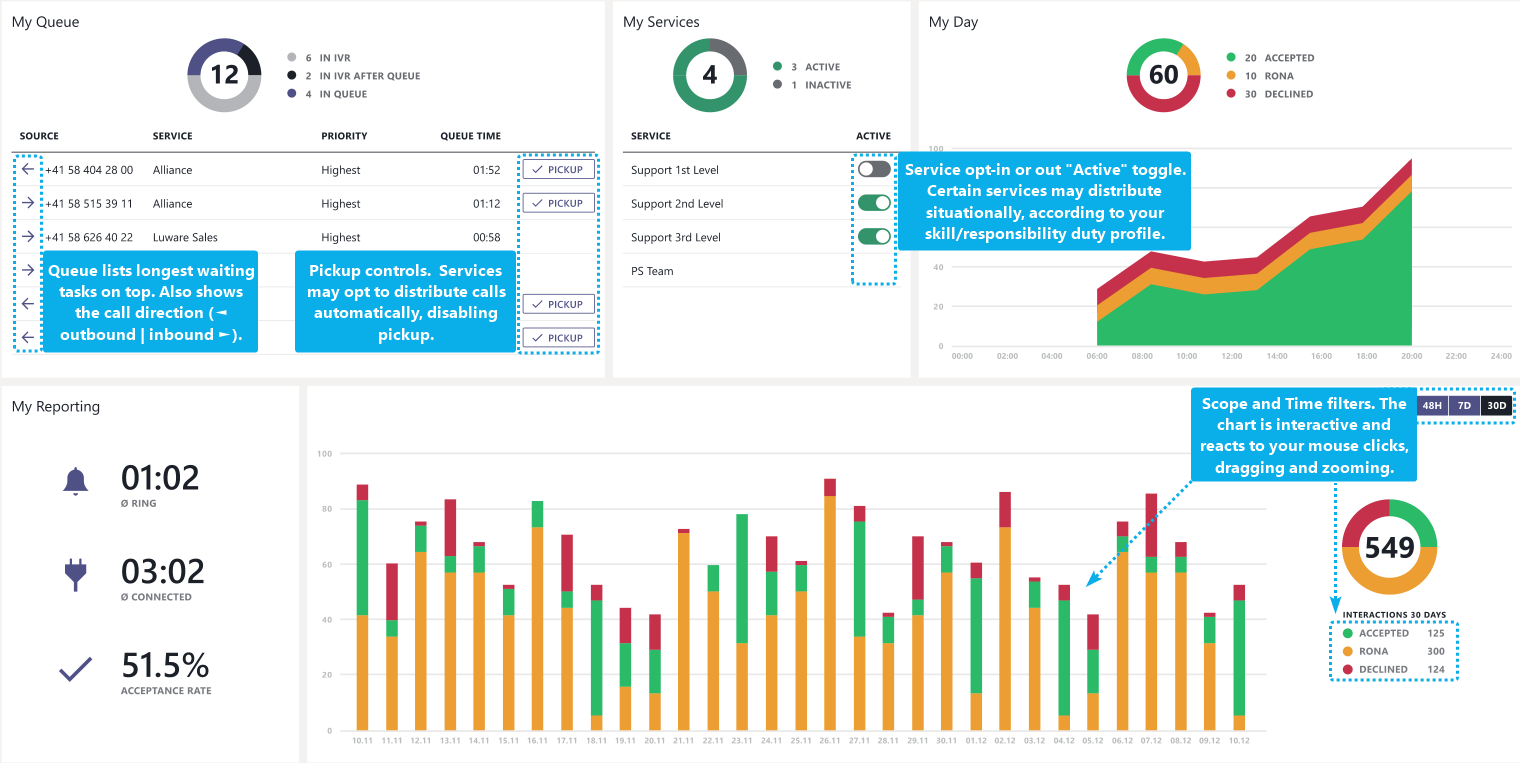
"My Overview" example screenshot
💡 Please note that this is a mockup. Details in your live-view may appear different.
My Queue & Services Overview
These widgets inform and steer your call handling and service participation, listing entries from all services you are a part of.
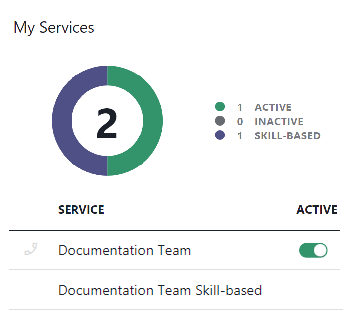
- Services may offer “outbound” controls (next to the service name in the Services Overview widget), allowing you to make calls on behalf of that service.
- If the active toggle is switched off in the Services Overview widget, calls from that service will no be distributed to you.
- Being on duty / off duty for the service doesn't influence the count.
The UI elements shown in "My Queue" and "Services Overview" widget can vary depending on your Service configuration:
- The two widgets "My Queue" and "Services Overview" directly correlate to each other, meaning that if you set yourself inactive for a certain service you will not receive calls from that service in the "My Queue" widget anymore.
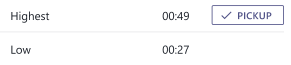
- When you are part of multiple services simultaneously - each with their own workflow - a mixture of automated and manual call distribution is possible. Call "Pickup" controls are only shown when the workflow of your service is set to an according Distribution Type. This is configured by your Nimbus service administrator.
- When no pickup controls are shown, Nimbus will distribute tasks automatically to you, processing the call queue by task priority, then by longest-waiting "Queue Time".
💡 When you get a call in queue and toggle activity, Nimbus will attempt to distribute the call to other (online & active) service team colleagues.
My Day
This widget lists your current-day caller interactions and resolutions (handled, declined, RONA) across all your Services.
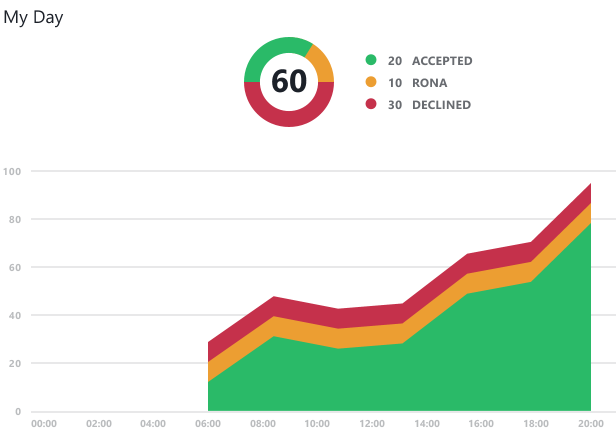
My Day Widget
🔍 The widget gets updated whenever a task is resolved (call workflow completed). You can check your task history in the My Sessions view.
My Reporting
This widget provides you with a history report over the selected time range.You can filter the view by:
- Today (Current)
- Last 2 days (48h)
- Last 7 days
- Last 30 days
Additionally further KPI such as your your average ring-time, connected-time and acceptance rate is updated depending on the selected time range.

My Reporting Widget
💡 The widget gets updated whenever a task is resolved (workflow complete).
GOOD TO KNOW
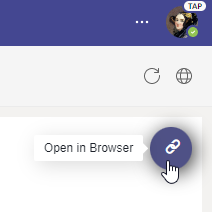
By default the Nimbus app opens the "My Overview" in your Microsoft Teams client. However you can also open and access all Nimbus functionality within in your browser by using the "Open in Browser" button at the top right.
|
💡 You can also open the Nimbus "Portal" with the entire functionality also via the following links: Portal URLs:
✅ Make sure to configure your web proxies to allow access to these domains or whitelist the complete *.luware.cloud domain. 🔍 Refer to the Usage of Nimbus section to learn about all other UI concepts and views available to you. |