The Statistics tab aggregates long-term Service statistics for the currently selected Service. Nimbus gathers this historic data in the background and stores it in a database as defined per Reporting Model.
PRECONDITIONS
In order to see meaningful data in the Statistics tab, you need the following:
- A Service with at least one "Active" User (either Teams Channel owner or member) to receive and handle Nimbus-distributed tasks.
- Via the Service Settings: Workflows in place to handle the incoming / outcoming Task Queue and Distribution.
- At least one productive day of operation to get meaningful aggregated data being shown in this view. You can also make test-calls via General Service Settings to generate first task results.
💡Note that certain Widgets may not be shown when features are disabled in the Service Settings.

FILTERING
You can get detailed data point details by mousing over the chart areas as shown in the example above.
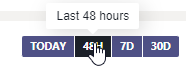
Use the filter controls to dynamically adjust the scope (time period) of shown data points:
- Current Day: all calls from today from 00:00 until the current time.
- Last 48h: last rolling 48h
- Last 7 days: last rolling 7 days (168h)
- Last 30 days: last rolling 30 days (720h)
Service Statistics
This widget collects Service team metrics individually for each User. Data is aggregated from multiple productive days up to 1 month (30days).
The following elements and options are shown:
| Widget Area | Description | ||||||||||||||||||||||||||||||||||||||||||||
|---|---|---|---|---|---|---|---|---|---|---|---|---|---|---|---|---|---|---|---|---|---|---|---|---|---|---|---|---|---|---|---|---|---|---|---|---|---|---|---|---|---|---|---|---|---|
|
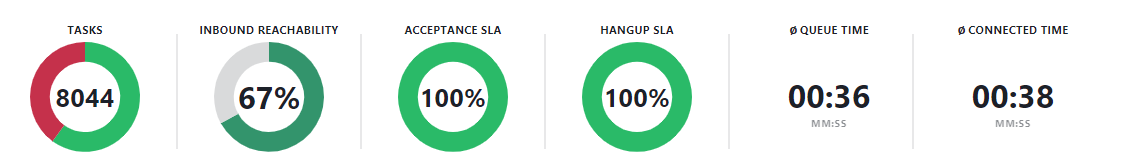
Top Row: Service Metrics (Widgets)
|
Shows the following Metrics:
1✅Only shows when Inbound / Outbound Conversations are enabled in Modalities Service Settings. 2✅SLA thresholds are configurable in the General Service Settings. 3💡 Manually engaged Call On Behalf are not considered in this statistic. |
||||||||||||||||||||||||||||||||||||||||||||
| Bottom Row: Task Results (Chart) | Shows per-day task results as bar chart for the selected (filtered) time period. Show Task Results Legend…INC Task Result Legend
🔎 Related concept: These results are part of the Nimbus Reporting Model > Static Dimensions > “Service / User Sessions Outcomes”. 💡 Tip: You can also click on the legend at the right hand side to toggle the data points on and off. 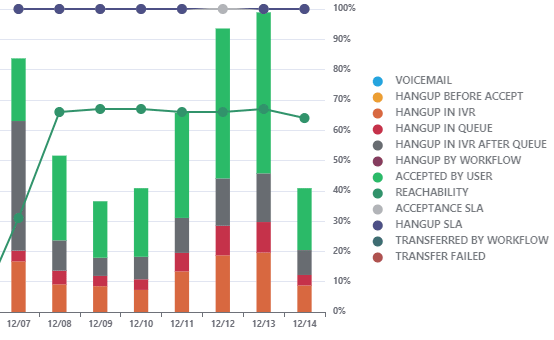 |
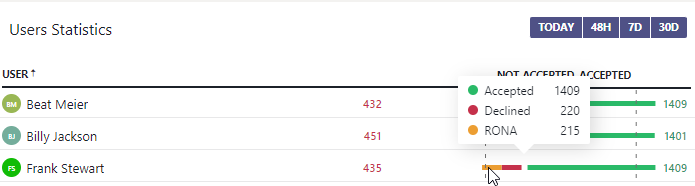
Users Statistics
This widget lists User Sessions and their outcomes. Data is aggregated from multiple productive days, up to 1 month (30days).
The following elements and options are shown:
| Widget Area | Definition |
|---|---|
| Left Column: User (Names) | Nimbus Service User. |
|
Right Column: Task Result (Bars and Numbers) |
Shows data bars for accepted / not accepted tasks. A mean average bar is shown as dashed line 🔍 RONA status is also counted as not accepted. 🔍 A full list of User session outcomes can be found under Nimbus Reporting Model > "Static Dimensions" > "User Session Outcomes". |
| Bottom: Legend |
You can click on the legend entries to turn data points on and off. 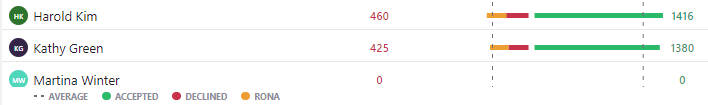
|
Tasks Heatmap
This widget contains a heat-map comparing task resolutions on a 1-4 week scope.
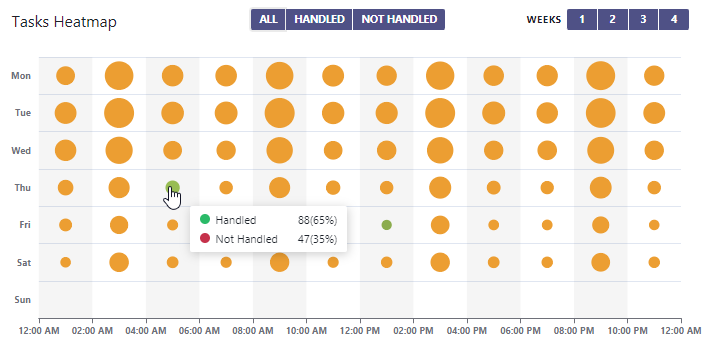
| Widget Area | Definition |
|---|---|
| Left: Weekday (Row) |
Sorts and displays the accumulated tasks per day as a filled circle. Bigger circles mean that more tasks (of the filtered "Task resolution Type") have been recorded that day and hour. The circle size is always rendered in relation of smallest to largest amount of tasks counted within the given time period. 🔍 In the Nimbus KPI Calculations Tasks outcomes can either be "handled" or "not handled". A comprehensive list can be found under Static Dimensions → "Service / User Session Outcomes". 🔍Detailed results are not part of the UI, but part of the OData Feed used for the Nimbus Power BI Template. |
| Bottom: Time of Day (Column) | Summarizes tasks in hourly intervals |