The "My Overview" tab is your personal starting dashboard, combining daily call metrics, call handling and team presence in one view. It combines functionality and data gathered from all services you are a member of.

Status Header
💡While not specific to this view, it is worth noting the header, as it is the first thing you see on this or other Nimbus views:
INC User Status Header
✅ Precondition: You need to be part of least one Nimbus Service to see header details. Task count and modalities shown in your header depend on Task Parallelization settings configured in your General User Settings.
The status header is visible in multiple UI areas of Nimbus, keeping you informed about your Nimbus task & service status at a glance.

💡 Note that this is an example: features and services available to you may vary, based on your user settings and individual service configuration
Depending on your user settings and the service configuration the header will show the following:
|
Your Nimbus State (Teams Presence & Readiness) |
This includes:
🔎 Note that your current User State signals “Readiness” to receive tasks from any of your services . It is a combined status from all your Nimbus services. Based on these criteria, each service can individually consider you as “Ready” or “Not Ready” to receive new tasks. ✅ Service Owners: “Readiness” criteria for MS Teams Presence can be defined individually in the Distribution Service Settings. Advanced features such as Task Parallelization settings may also impact user Readiness. |
 and the resulting (2) Nimbus Readiness state  |
| When Emergency Manual Presence Mode is enabled |
Situational option: If Microsoft Teams presence sync is unreliable or unavailable, Tenant Administrators can enable Emergency Manual Presence Mode in Extensions Tenant Settings. This stops syncing presence from Microsoft Teams entirely. 💡During Emergency Manual Presence Mode enabled, you can set a simplified presence by clicking your User Avatar Icon. You will keep the known Responsibility Profile selection for skill-based services. |
 |
| Service assignment / participation |
Depends on the User Assignment Type of all the services that consider you as a member / agent.
|
 |
| Task Capacity |
Depends if Task Parallelization is enabled for your user1. Configured by an Administrator in your General User Settings, this determines:
1💡Reaching the task maximum also marks you as “Not ready” for that type of task. |
 Red indicates maximum. Greyed-out modalities are not enabled for your user. |
| Call on Behalf call controls |
Call On Behalf call controls, allowing you to directly start outgoing calls on behalf of any of your services. 💡Note that preconditions for “Call On Behalf” apply. Not all Services may have the feature enabled or configured. |
 |
My Queue
This widget widget informs and steers your call handling and service participation, listing queued tasks from all services you are a part of. When you are part of multiple services simultaneously - each with their own workflow and Distribution Type setting - a mixture of automated and manual call distribution is possible.→ Also see “My Services” below.
💡Good to know
When Task Parallelization was enabled for your Nimbus user account, you may get multiple tasks from the queue in parallel. A requirement for this is to have tasks parked, either via My Sessions or Attendant Console, as “My Overview” is not designed to handle the tasks.
My Services
The “My Services” widget directly affects your visible tasks in “My Queue” meaning that if you set yourself “Active” you will receive calls from that service in the "My Queue" widget, and vice versa.
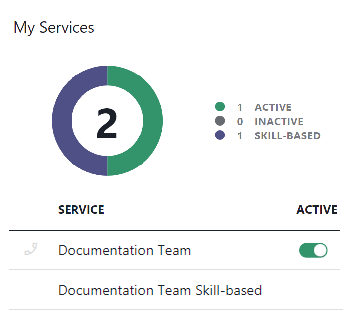
☝️Note: UI elements may vary on service / user settings
- Note that the “My Overview" call controls depend on Distribution Service Settings and the User Assignment Type of the underlying service. For example:
- Nimbus may distribute tasks to you automatically, processing the call queue by task priority, then by longest-waiting "Queue Time".
- You may also not see “Active” controls at all, e.g. when the service uses to match your Skills and Responsibilities with its internal Distribution Policy. In such cases you steer your service participation with your Duty State and underlying Responsibility Profiles.
- Additionally, some services may offer Outbound Call controls allowing you to make Call On Behalf of that service.
My Day
This widget lists your current day caller interactions and resolutions (handled, declined, RONA) across all your services.

💡Good to know
- You can filter the view by clicking on legend entries. However, for more specific results you may want to visit the Statistics page. You can also visit your task history in the My Sessions view, e.g. to conclude pending After-Call Work (ACW) from your day and prior sessions.
- The widget gets updated whenever a task is resolved – call workflow completed and the underlying Nimbus Reporting session concluded.
My Reporting
This widget provides you with a history report over the selected time range. You can filter the view by:
- Today (Current)
- Last 2 days (48h)
- Last 7 days
- Last 30 days

💡Good to know
KPIs, such as your your average ringing time, connected time and acceptance rate, are updated depending on the selected time range. The reporting widget gets updated whenever a task is resolved (workflow complete). For more details on how these times are calculated, visit Nimbus Reporting the Nimbus Reporting Model pages.